Summary
Current change detection
(1) Utilising either post-classification anlysis ⇒ classify contents of two different image, then compare them to identify difference.
(2) difference image analysis ⇒ constructs DI(difference image)
DI : highlight the differences between two same but temporally difference scene. In this paper, We will use (2) difference image analysis.
Main object
(1) determine the efficacy of using the feature maps generated by U-net of two images to create an effective DI (효과적인 DI 생성에 사용할 피쳐맵의 효능을 결정함)
(2) Accurately classify the changed part automatically
(3) Build a robust model from noise
(4) Build a image that represent detected changes using semantic segmentation
Model
Proposed model is based on U-net. It has two phases : (1) training (2) inference
(1) Training Phase
Dataset : Vaihingen dataset Total 33 satellite image from 1 larger TOP image.
Only 16 images have their corresponding ground truth set.
All images are 320 X 320 X 3.
All image pixel values for each color channel were nomalized (mean : 0.5, deviation 0.5)
Semantic segmentation
Training set : 15 images and their corresponding ground truth images.
Validation set : 1 image and its corresponding ground truth image.
Class : 3 semantic classes / buildings, immutable surfaces(kinds of roads and parking lots), backgroud (non of the other classes, like vegetation )

Change Detection
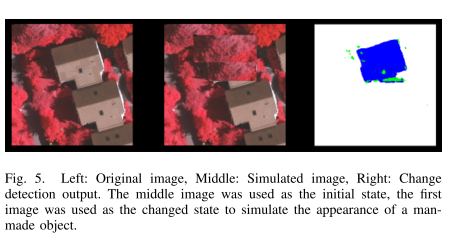
Since there's no temporally different images of same area, changes were simulated by editting manually.
20 random images were selected and each images has different changed-pixel rate (5, 10, 15%)
Training set : 20 images and their corresponding changed image by manually editting Class : None / Unsupervised
Training Parameter
Optimizer : Adam batch size : 4 loss function : log loss (cross-entropy function)
Measures of Accuracy
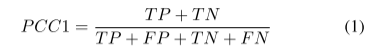
(1) Accuracy equation for predicting changed or unchanged (PCC1)
TP : Number of pixels that correctly classified as chaged
TN : Number of pixels that correctly classified as unchaged
FP : Number of pixels that incorrectly classified as chaged
FN : Number of pixels that incorrectly classified as unchaged
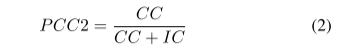
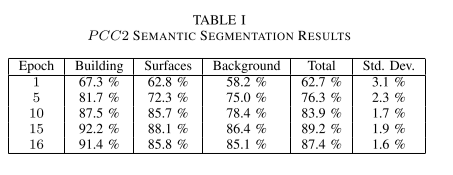
(2) Accuracy equation for predicting correctly classified (PCC2)
CC : Number of pixels that correctly classified as semantic class
IN : Number of pixels that incorrectly classified as semantic class
(2) Inference Phase


Modifing model to accept two images.
- Each feature maps from U-net's 5 levels are saved for the first image.
-
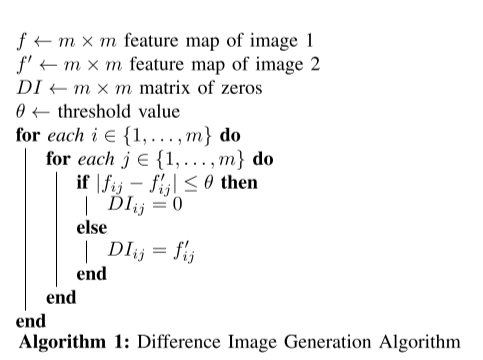
- DI genereation Algoritm
Compare first and second image's corresponding element pair.
If absolute difference falls between 0 and a threshold, corresponding DI element becomes 0.
Otherwise, DI element is generated by second image's feature map activation.When second image is accepted, DI is created at each 5 levels, using first and second images' feature map.
- DI genereation Algoritm
- Then, 5 DI images are used by the decoder in copy and concatenate, Insted of the feature maps generated by the second image encoding phase.
- Thus, the output of the model is semantically segmanted.
(3) About DI threshold
According to empirical test, threshold must differ at each U-net levels.
- Level 1 : 0.4
- Level 2 : 0.6
- Level 3 : 0.8
- Level 4 : 1.0
- Level 5 : 1.2
Model Hyperparameter
(1) Layer activation function : leaky ReLU (slop : -0.2) / Output layer : softmax
(2) Input size : 320 X 320 X 3 (RGB)
(3) Convolution operation : 1 stride 3X3, padding 1 / batch normalisation
(4) Deconvolution operation : 2 stride 3X3, padding 0 / batch normalisation
(5) Unet Encoder : Consist of 4 levels, 2 convolution ops and max pooling (2 stride 3X3 padding0)
(6) Unet bridge : 1 level, 2 convolution ops, no max pooling.
(7) Unet Decoder : Consist of 4 levels, 2 convolution ops and 1 Deconvolution ops
(8) Final level : 3 convolution ops
(9) Number of kernels : First level at 64, no changed in same level (Due to 1 padding), doubled at each encoding levels, reaching a total 1024 at bridge. Then halved at each decoding levels, reaching 64 at last level. Final convolution ops reduced channels to 3.
Result : Change Detection
Best performance served at epoch 15.
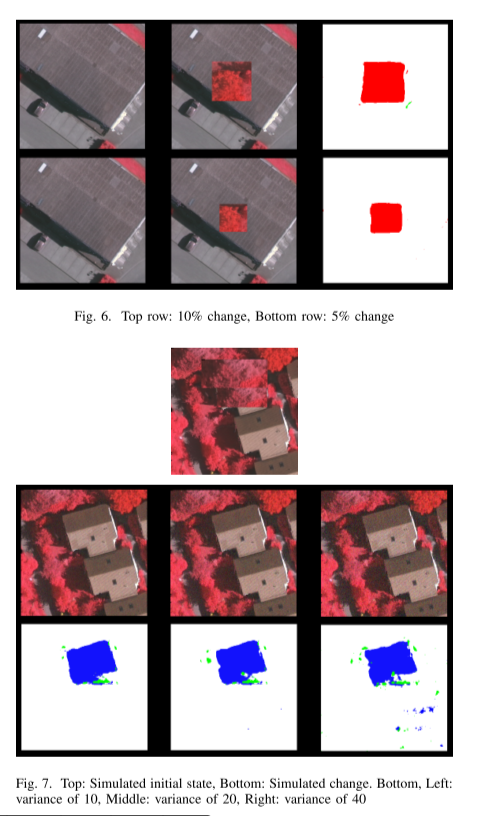
The model can detect difference of building's appearance, disregarding irrelevant pixels. Some small cluster of pixels appeared. This clusters depended on DI threshold values. (See DI threshold.)

Greater differences between 2 images makes grater differences in feature maps. Namely, 10% changed output was less accurate than 5% change output.
Gaussian noise was added to test robustness of the model. Low and moderate noise caused decrease of change classification accuracy. And if noise beacome larger, more decrease of accuracy appeared.
The model performed worst when changes are situated on the edge of an image. This is likely a result of kernel convolviong over fewer data points. This can be improved by cutting High-dimensional satellite images into overlapping subsets, or combining change detection signals generated by the overlapping areas.
